In a prior blog post, we looked at financial bubbles, and this article will further expand on the bubble framework.
Financial bubbles are not new for investors and have been a close part of financial history when going back to the early days of the Dutch Tulip Mania (also known as the Tulip Craze or Tulpenwindhandel in Dutch) in the 1630s when the prices of newly introduced tulip bulbs surged to historical highs from 1634 to 1637. The peak of the tulip mania was in February 1637, when one tulip bulb was selling for more than ten times the average annual salary of a skilled craftsman. Since then, we have seen a lot of events with substantial financial market speculation that, in hindsight, have been classified as financial bubbles. Some of the big financial bubbles historically are:
- The Dutch Tulip Bulb Bubble (1637)
- The South Sea Bubble (1720)
- The Mississippi Bubble (1720)
- Stock Market Bubble (1929)
- Bank loans to Mexico and other developing countries (1970s)
- Gold price bubble (late 1970s)
- Bubble in real estate and stocks in Japan, Finland, Norway, and Sweden (1985-1989)
- Bubble in real estate and stocks in Thailand, Malaysia, Indonesia, and several other Asian Countries (1992-1997)
- Bubble in growth and over-the-counter stocks in the United States (1995-2000)
- Bubble in real estate in United States, Britain, Spain, Ireland, and Iceland (2002-2008)
Typically, new financial bubbles are created from previous bubbles when some intervention from either fiscal or monetary policy is added. Therefore, it is no surprise that the number of financial bubbles has increased since the beginning of 1900, when central banks started dominating the financial landscape. Even more worrisome is that the number of manias in both listed and unlisted assets has increased dramatically since the last “innovation” from central banks in the form of quantitative easing in November of 2008. We have seen authorities utilize a wide range of tools to combat economic downturns, which have fueled financial bubbles through the lens of liquidity. Among other things, we have seen bubble-like characteristics in Cryptocurrencies, Cannabis stocks, and Clean Energy stocks in newer times.
The four components of a mania
Several characteristics of financial bubbles are inherently hard to forecast, such as the extent of speculation involved. Yet, the elements that trigger these incidents are clear and understandable, enabling investors to spot potential instances. Typically, four essential components are necessary to instigate a speculative surge.
- An event that ignites interest from investors
- Overall theme
- Easy access to money (significant liquidity)
- Widespread participation through different instruments
- Event
Usually, an instigating factor causes a rush towards a particular asset class. This persuades market players to disregard conventional valuation measures and find reasons to justify why, in this instance, the principles of careful investing should be set aside.
- Theme
Market frenzies also necessitate an inspiring long-term structural narrative that can captivate investors, prompting them to invest significantly. In most cases, such themes don’t materialize suddenly and turn into bubbles. The attractive structural narrative usually existed for years before speculative excesses accumulated. What happens is that as the theme evolves, investors gain validation and, paradoxically, become more confident as prices escalate (i.e., the narrative transitions into a perceived “fact” and seems “invincible”). Even though the initial fundamentals driving most asset frenzies are valid, the issue lies in investors becoming overly optimistic about potential returns and inflating the asset’s value (i.e., they excessively project the theme).
- Easy access to money
An ample availability of inexpensive capital typically fuels bubbles. Surplus liquidity invariably finds its way into certain assets, generating demand and driving price surges. This phenomenon is especially prevalent when interest rates are unnaturally held down, either due to a mitigating force keeping consumer price pressures in check or when monetary authorities and/or bond investors overlook inflation risks by falling significantly behind the economic growth trajectory.
- Widespread participation
Market frenzies necessitate broad public involvement. Therefore, there must be an easy method for individuals to invest in the targeted asset class. The accessibility of most assets has been enhanced due to the globalization of capital markets, advancements in technology, and the introduction of investment tools like ETFs.
Different phases of a financial bubble
No bubbles are ever the same as the previous bubble, but the phases typically bear the same shape. In general, you can use the following graph to illustrate the process of a financial bubble. However, looking through all previous historical bubbles reveals that they typically go through six distinctive phases.
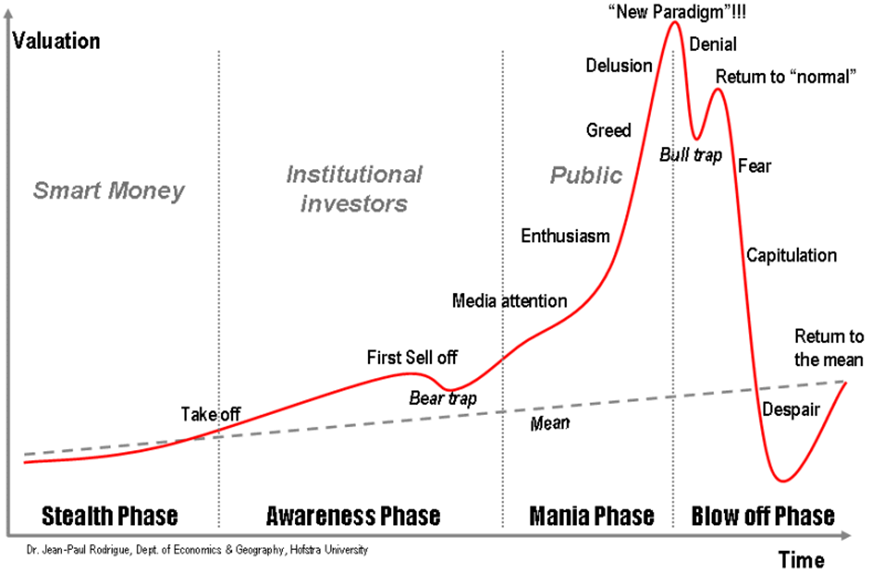
In the first phase, the investment experiences a general bull market with steady and orderly price appreciation. In the second phase, the investment experiences the first real sell-off in the bull market due to economic phenomena and a general risk-off environment. As the sell-off ends, many market participants realize that the theme will continue to pull forward and increase their conviction that the investment theme will last longer. This is where the main bubble event happens, typically a parabolic price move. In the illustration above, this is a period where media attention and public enthusiasm will lead to a great-like situation for investors, typically resulting in a final blow-off top. Usually, this stage will last two years, and the final blow-off the top will be within months. If we look back at the Dutch Tulip Bubble and the price data, the parabolic price rise happened primarily from 1635 to 1637, with the blow-off top happening in a few months during 1637. After this period, when all retail investors have been dragged into the bubble, the price will see the first major down leg following the parabolic up leg. These types of corrections can be rather consequential and substantial. Still, the key is that investors and market participants believe this to be an excellent opportunity to add additional exposure to the investment despite deteriorating fundamentals. This type of correction is a bull trap where investors believe that prices will return to normal, but the deteriorating fundamentals will negatively bias the price. It ultimately leads to the final big crash, where all market participants realize that the prices have deviated too much from fundamentals, forcing everyone to exit. In this kind of move, we see fear and capitulation, which increases the number of sellers. Statistically, this type of crash will take the price below the point where the parabolic move started. However, it is essential to know that these kinds of crashes will experience short countertrend rallies since prices never go in a straight line. These countertrend rallies will become smaller and smaller as we approach the bottom, ultimately leading to the completion of the crash phase, which will either force the asset in question to disappear or mark the beginning of a new uptrend.
Real-world example of the different phases of a financial bubble (Dotcom)
The technological revolution started long before the Dotcom bubble, but ongoing development during the 1990s led to the development of the Internet and affordable computers (Event). This process led investors to believe that the world was dramatically changing, and traditional valuation metrics were no longer sufficient and correct to deal with this new world (Theme). Meanwhile, Japan had a prolonged recession and deflationary conditions, which helped put a ceiling on global monetary conditions. Also, the policy rate in the United States was lowered in 1998 due to the EM crises in the fall of 1997 and the LTCM blow-up (a highly levered hedge fund that ended up creating systematic risks in the financial system due to the contagious element of leverage) in 1998. These events helped create the perfect conditions for a speculative frenzy (Easy access to money). Since investors after these events were convinced that nothing could go wrong, widespread participation started to take place, which created the parabolic surge of 1999 and 2000 (Widespread participation).
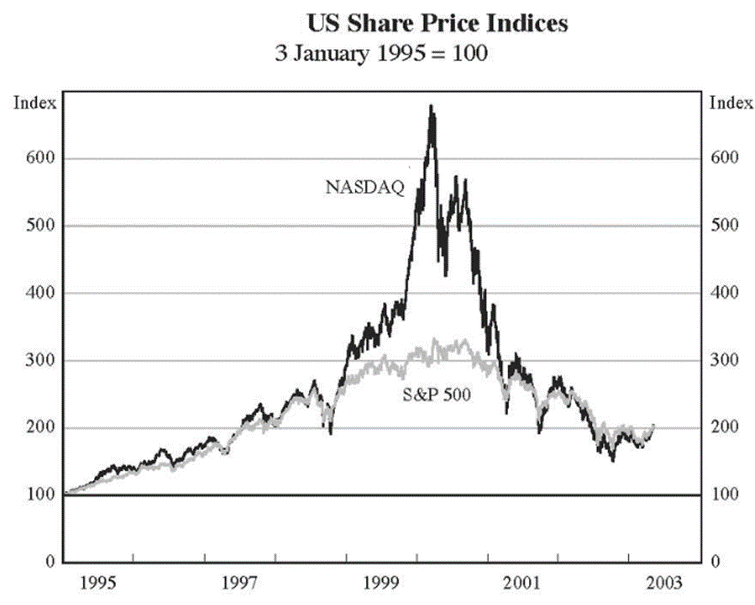
Looking at the Dotcom bubble, it is easy to see the six phases. The bull market continued from 1991 to 1997 with steady price appreciation (Phase 1). In 1997, the first major sell-off occurred due to the economic fallouts from the EM-crises and LTCM blow-up, which prompted intervention from states and central banks (Phase 2). This created the perfect conditions for a speculative frenzy, which created the parabolic rise in the price of technology stocks (Phase 3). After the blow-off phase, a major sell-off occurred, which gave investors the perfect opportunity to increase exposure despite deteriorating fundamentals (Phase 4). Since cracks in the fundamentals started to get more noticeable, everyone started to head for the exit, which caused massive sell-offs and panic selling (Phase 5). Towards the beginning of 2003, the erratic price movements started to fade, which was a clear signal that most market participants had abandoned technology stocks. Together with improving fundamentals, this gave birth to the perfect conditions for a market bottom and a new bull market (Phase 6).
What can you use this framework for?
Financial bubbles are easy to identify in hindsight. However, the following phases and components of financial bubbles will give you the tools to identify when the market conditions in the different asset classes warrant extra attention. As George Soros once said, investing in an asset class undergoing bubble-like characteristics can be extremely profitable. The key is to participate and tighten up your risk management in case the bubble bursts or you go into the final blow-off stage. The framework will help you do just that.
Timing the exact top of a bubble is near impossible, but there are certain characteristics in the price movements combined with volume and chart patterns that reveal when a bubble is about to burst. I will try to make a blog about that soon.
In the meantime, thank you for reading, and if you have any questions, please do not hesitate to contact me.